Statistical Correlations between Power Generator Complexes, and Average Retail Rates (w/ EIA Data: 2023-2024)
3/7/2025
I posted an abbreviated summary about this on LinkedIn recently: https://www.linkedin.com/feed/update/urn:li:activity:7300893825512755200/. So here is a more elaborate dissection of the “fun” I had with some numbers available via the EIA.
Yea… I know: 🤓🤓🤓… 🤷🏽♂️
I’ll reiterate the question that I was hoping to answer: can we discern any notable relationship between different, grid-based, energy technologies; and our electricity costs across the US? Again - we’ve all heard plenty of opinions, conjecture, and hearsay on this topic. And I’ve reviewed some analytical evaluations that examine these energy costs by source. But I can’t say that I’ve seen any statistical approaches to this question.
Using a 12-month snapshot from October 2023 through September 2024 (since this window provides the most recent, aggregated outputs of all pertinent generator assemblies on the US grid) – I collected power outputs (in GWh/year) from all operating generators (coal, natural gas, nuclear, conventional hydro, wind, solar, biomass geothermal, PSH, and even BTM solar!) by state; total, state-by-state power generation and electricity sales; and average, retail electricity prices by state. Are there any correlations between these disparate generators, and average retail pricing on a nationwide scale?
This Excel data (not for the faint of heart!) is on display below:
Running a Pearson correlation test on all of this data in Excel is actually pretty straightforward: simply upload the “Analysis Toolpak” within the “Data” heading; open “Data Analysis;” select “Correlation;” and highlight all of the relevant data for a comprehensive, bivariate analyses. Since state grids can vary (appreciably!) in size and scope - larger energy volumes (from more populated and power-hungry states) could eschew nationwide results and comprise the integrity of these results. I accounted for these size discrepancies by adjusting total generator output (by state) as a percentage of each state’s:
Accumulated energy production (in GWh/year)
Combined electricity sales (also in GWh/year)
But upon closer inspection - there looked to be segments of this data that really should be “cleaned up” in order to encourage more confidence in the correlation coefficients. To be more specific:
ALL bivariate XY scatter plots involving average, state electricity pricing pointed to Hawaii as a conspicuous outlier. Therefore - HI was moved from this data population.
Select generators - like coal and nuclear - aren’t present in every state; and, therefore, fail to contribute to total power output, electricity sales, or average retail pricing in select states (as indicated in the below scatter plot). As a consequence - states that lacked any specific generators on their grid were removed from any subsequent, comprehensive, statistical examinations of said generators across our domestic grid (i.e. states like CT and MA have on coal-fired combustion facilities; ergo - both CT and MA data were removed from any further correlation tests involving coal-fired electrical energy and regional grid costs)
After implementing the above corrections across this data set - I created separate categories for combined Wind-Solar (just the addition of both VRE platforms into a single column), “Renewables” (which includes wind, solar, conventional hydro, geothermal, and biomass), and “Low Carbon” (which includes all the “Renewables” category, plus nuclear); adjusted for any state-by-state disparities by making all categorical outputs as a percentage of total sate power generation tallies and generated power sales; than ran these Pearson correlation tests. The summarized findings were:
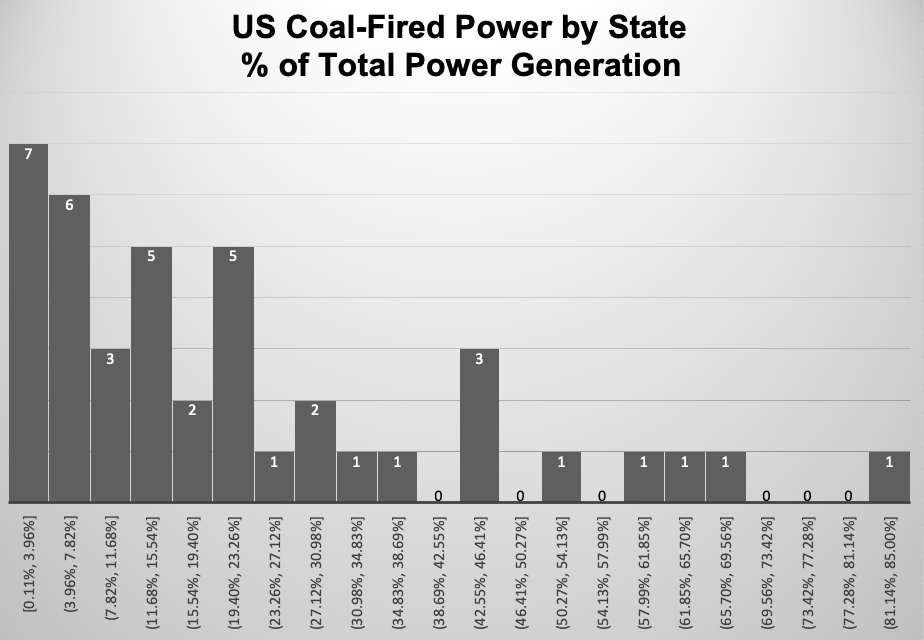
Coal-fired power - as a percentage of both cumulative energy generated and energy sales - exhibited the strongest impact on depressing average electricity pricing across the US, with respective r values o -0.393 and -0.356; indicating that coal generators have a slight moderate effect on lowering their respective state’s grid prices)
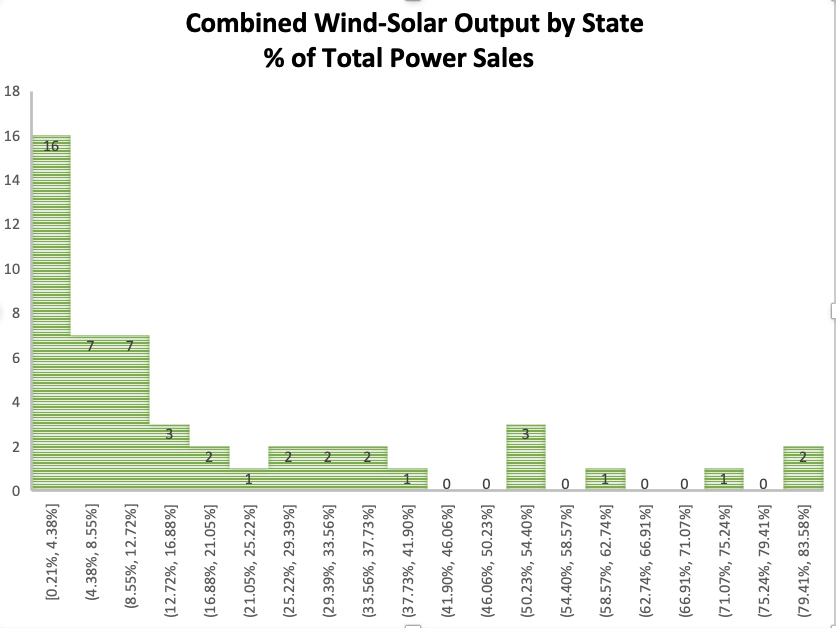
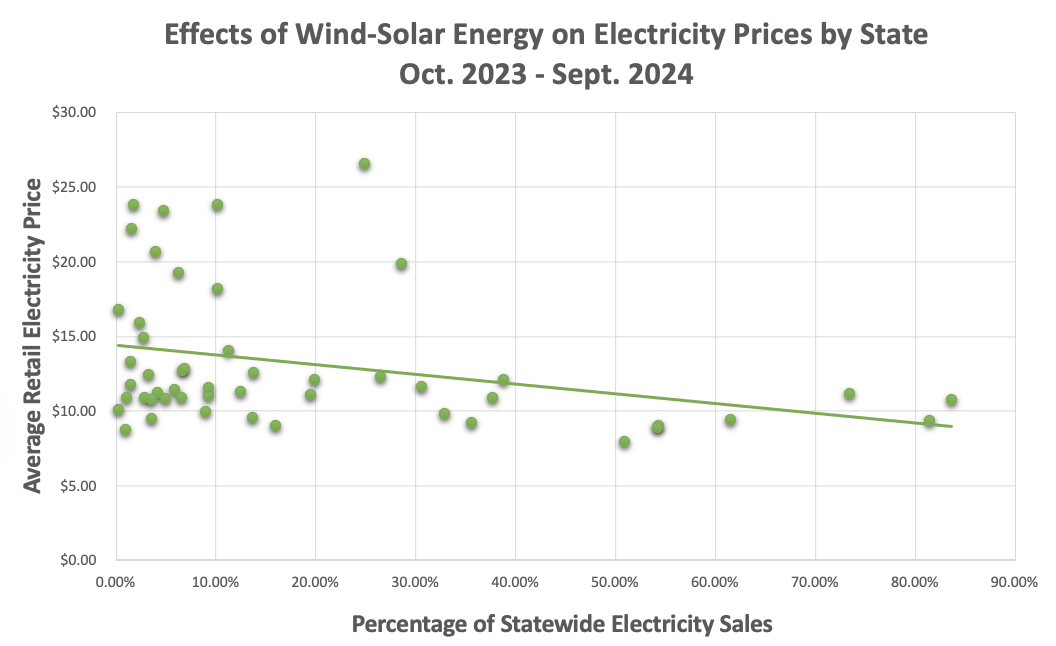
Combined wind-solar output - as a percentage of cumulative energy sales - had a less-than-moderate (but certainly not negligible) impact on reducing statewide electricity costs, with a r value of -0.3116
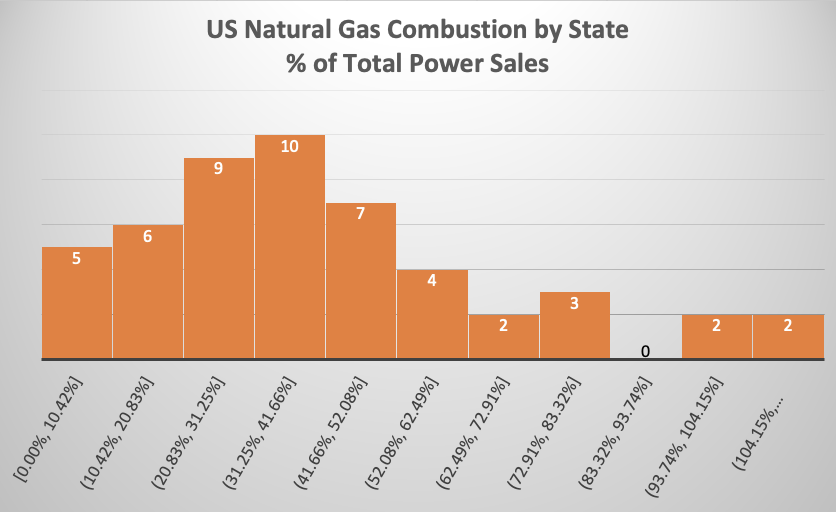
Surprisingly, natural gas combustion - as a percentage of cumulative energy generated - carried a very mild positive correlation with relatively higher average retail pricing, with a r value of 0.3176
All other significant generator resources (nuclear, “Renewables,” “Low Carbon”) - as a percentage of both cumulative energy generated and energy sales - yielded weak (i.e. <|0.3|) or inconsequential correlations to retail pricing
Combined wind-solar as a % of total statewide power generation, and natural gas as a % of total statewide electricity sales furnished weak correlation coefficients
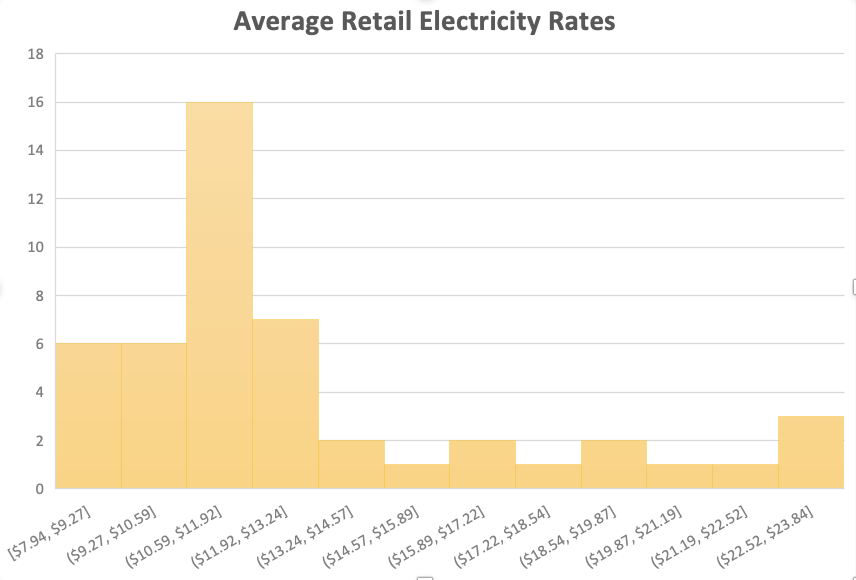
NOTE that the above histogram data for coal-fired and wind-solar energy are not normally distributed (while natural gas-fired generation and average state pricing histograms resemble more of a normal population distribution). While a Pearson correlation test doesn’t require data normality; it does assume it…. Therefore, I deemed it prudent to run the pertinent data through nonparametric, Spearman Rank correlation tests, in order to engender a little more confidence in these results.
Spearman Rank tests involve the ordinal ranking of all relevant populations, from highest to lowest. The RANK function in Excel (once you’ve selected the appropriate data list) can accomplish this seamlessly. Once the respective lists have been ranked - the CORREL function can determine their correlation coefficients. The ensuing, moderate-to-mild, monotonic relationships between power generator classification and average retail grid costs were:
Coal-fired power as a % of total, statewide generation = -0.4333
Coal-fired power as a % of total, statewide energy sale = -0.459.
Combined wind-solar as a % of total, statewide energy sales = -0.335
All of the other aforementioned, significant generator resource groupings bore Spearman rank correlation coefficients that were categorically weak (i.e. <|0.3|) or negligible
Note that all generator resource groupings - with the exception of natural gas - were populated with data that didn’t look to be normally distributed
For what it’s worth - the noted data from coal-fired and combined wind-solar power looks to be linear; as delineated in the trend lines below. And the parametric Pearson correlation tests are designed to quantify any potential, liner relationships between correlated data. So there is a little more strength to the above, Pearson correlation coefficients than what would typically be assumed with data from skewed distributions.
It’s important to specify that these findings are by no means “conclusions.” These correlations tests have their clear limitations; just to enumerate on a few:
Both the Pearson and Spearman tests only assess two variables at at time; while functioning grids (and their corresponding costs) are anything BUT…
Recognized correlations don’t necessarily equate to causation. And correlations between variables can indeed exist without manifesting themselves in a given test (since these results largely depend on samples; not an entire population of data)
Any argument that promulgates that coal-fired combustion and variable renewable energy (VRE) platforms definitely lower electricity costs on our domestic grid would be riddled with leaks. Furthermore - it would be disingenuous to posit that technologies like nuclear, hydroelectric, and natural gas generators only carry a marginal effects on regional electricity pricing, just because of the selected data in these correlation analyses.
But this certainly doesn’t mean that there isn’t SOMETHING to these correlation values! So while these findings are indeed disputable; my take-home insights from this exercise point to:
Dispatchable, baseload generation – recently in terms of legacy, coal-fired systems in the US – curbing utility-scale energy costs more than any other specific resource.
What’s interesting here is that coal is widely regarded as a more expensive fuel domestically when compared to natural gas; yet natural gas generators (NOT coal!) appear to demonstrate a slight, positive correlation with higher electricity costs. Obviously there is a plethora of inputs that factor into this data which are not accounted for within these correlations. But - just thinking out loud - I posit if:
The amassed age of our domestic, coal-fired generator fleet has allowed these assemblies to (overall) shed amortization costs and “settle in,” vs. the more-recently retrofitted natural gas combustion varieties
The youngest coal-fired station commenced operations well over a decade ago, back in 2013 (the Sandy Creek station in TX)
The lower flexibility of coal-fired power generation - when compared to natural gas - likely allows these assemblies to operate at a much more consistent, and less vacillating pace
Natural gas is much more of a versatile fuel, and its generators are more modular by design. Consequently - any incremental additions to a regional grid WILL come from natural gas combustion when compared to coal, due to its higher dispatchability and lower capital requirements. However - these incremental additions may supersede grid demand growth (for at least a period of time); thereby lowering the capacity factors of these new additions. Low-capacity factor natural gas should carry higher relative costs; since these assets will sit idle for longer periods of time (just like the elevated costs structures associated with natural gas peaker facilities, which function only during and around peak demand intervals). Are the higher “carrying” costs affixed to more recent generating systems being reflected in the aforementioned, positive correlations between enhanced natural gas combustion, and elevated electricity costs?
VRE platforms – in spite of their complications for grid operation (intermittent by nature, with only short-term firmness when colocated with storage; likely more distributed vs. centralized, etc.) – improving the economics of electrical energy across our domestic grid. And these benefits are statistically quantifiable using contemporary data!
An all-of-the-above strategy – involving thermal baseload sources with renewable assemblies (with storage) – as a WINNING formula to lower grid costs! ⚡️💵 📉 🤑
The reference materials showcased in “A Pragmatist’s Guide to Energizing the USA” certainly endorse the tenets of a diverse and redundant domestic energy matrix. And now - we have some statistical signals (which were NOT evinced in A Pragmatist’s Guide…) that point to a similar verdict
Moving forward - it will be very interesting to track and deduce:
How aging coal infrastructure - with their higher R&M costs (some of which have already begun manifesting across disparate utilities) - might influence these correlation coefficients?
What effects will further market penetration of solar and (to a lesser degree) wind generation have on average pricing?
What benefits (in terms of firmed capacity to help offset peak demand costs) - or handicaps (in terms of ancillary capital requirements) - might augmented battery colocation have on these VRE-to-retail pricing correlations?
Note that the EIA didn’t provide any BESS-related data in their numbers
How have these ‘23-’24 correlation coefficients shifted from ‘22-’23, and then from ‘21-’22, and so forth?
With regards to the latter bullet point… STAY TUNED…