VRE Power Generation Correlations with Average Retail Electricity Rates: 2018-2024
3/30/2025
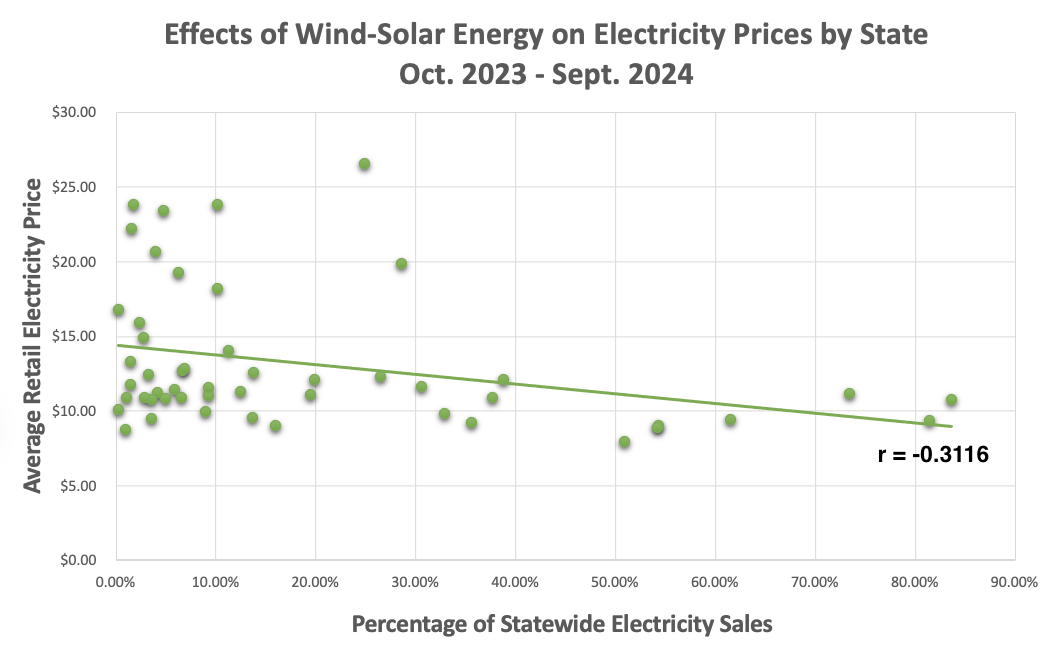
In continuance of our analysis under the “’23-’24 Statistical Correlations” subpage – please recall that combined wind-solar energy generation – as a percentage of cumulative, state-by-state electricity sales – exhibited a mild correlation with (relatively) lower retail prices across the US grid from October 2023, through September 2024. An interesting signal for sure; but limited, given the fact that this analysis only encapsulated a 12-month window. What do these correlations (if any) look like over a multi-year span?
Leveraging the very same EIA data source; and constructing very similar, inclusive spreadsheets as pictured within the aforementioned subpage – I collated the following data points that cover combined wind/solar assembly outputs as a share of each state’s tallied energy sales over a six-year time frame; from 2023-2024 dating back until 2018-2019:
Pearson correlations (via Microsoft Excel) were imposed on each 12-month group above with their respective, average state retail electricity pricing; excluding data belonging to Hawaii (recall from our earlier analysis that Hawaiian retail electricity costs were ostensible outliers). Moreover – each group also underwent a Spearman Rank correlation analysis; since annual VRE data (as a percentage of electricity sales) over this six-year duration didn’t appear to be normally distributed. In the following chart - these correlation coefficients align with each respective group’s nationwide, 12-month:
power generation totals for combined wind-solar
power generation as a percentage of cumulative, US electricity sales
The above graph visualizes each 12-month group as data point, and documents how larger shares of VRE electricity on the grid (on display in the 3rd column in the above chart) match with stronger correlation values (the 4th column) between combined wind/solar energy, and lower retail prices for said grid. As outlined in “’23-’24 Statistical Correlations” subpage – the higher the absolute value of a resultant correlation coefficient; the stronger the measured correlation between two data groups (in this case; combined wind/solar as a percentage of each state’s grid sales; and each state’s respective, average retail cost for grid power over a 12-month period). Furthermore, a negative r value indicates an inverse correlation: higher portions of statewide grid sales comprised of VRE tend to point to lower statewide grid prices.
In short – this graph depicts how burgeoning market shares of combined, utility-scale wind/solar electricity on our domestic grid have realized a growing correlation with relatively lower costs for grid-based energy! To put (maybe overly) simply: more wind and solar on our grid correspond with lower retail costs for our grid!
Before we proceed here – please NOTE the following:
Correlation does not necessarily equate to causation! This point is worth reiterating. While the data does point to a strengthening relationship between increased VRE adoption and lower electricity prices; it cannot verify any sort of contributive link between the two.
These measured correlations are by no means “strong.” r absolute values of around 0.2 are undeniably weak and perhaps negligible. But r values that ascend beyond 0.3 become (somewhat arbitrarily; but NOT unjustifiably!) mild, and more noteworthy.
Pearson r values were graphed even though the employed, combined wind/solar data didn’t satisfy the parametric data assumption. However - as was the case within the ‘23-’24 Statistical evaluation - the correlated, scatter plot data looks to be linear:
Taking these r values at their quantitative “face value” could be misguided. Yes – the correlation between combined wind/solar as a percentage of electricity sales and relatively lower retail pricing do increase by almost 0.05 from 2020-2021 to 2021-2020 on paper. But that may not be congruous with any actual real world events on our grid during this time period. This r value disparity could simply be a manifestation within the data (and, therefore, more heuristic than anything concrete or empirical)
A potential measure of the viability of disparate group r values could be the actual, statistical difference between these group data sets. One-way ANOVA tests are a means to calculate the between- and within-in group variances between different population sets, and determine whether or not the differences between these data sets are indeed statistically significant.
Similar to the Pearson Correlation – ANOVA statistical analyses are available within with “Data Analysis” package in Excel: select “Anova: Single Factor,” and highlight the appropriate data sets. The subsequent ANOVA analysis of all six groups didn’t yield a significant difference between the group means (i.e the F-value was below the designated F-critical threshold; and the p-value was above 0.05)
It's worth pointing out that a student t-test between the 2023-2024 and 2018-2019 groups (select “t-test: Two-Sample Assuming Equal Variances” with the “Data Analysis” package) produced a sub-0.05 p-value; indicating that both groups ARE statistically different. Successive t-tests between the 2023-2024 set and the remaining four groups all failed to reject the null hypothesis (or indicate that the group means were significantly different than that of the 2023-2024). Note that:
Multiple t-tests (when you’re comparing more than two data sets) are typically discouraged when compared to an ANOVA; since an ANOVA can more confidently control for any potential errors
Both the ANOVA and student t-test assumes data normality; when this combined wind/solar data is non-parametric. But just like the Pearson Correlation test – normally-distributed data isn’t necessary to perform these statistical analytics
Both the ANOVA and t-test are considered quite robust formats when assessing non-parametric data (unless the data is severely eschewed, or the sample set is limited)
A statistically-significant difference between the 2023-2024 and 2018-2019 groups seems logical: total, domestic power output in 2018-2019 only represents about 55% of the 2023-2024 tally (and a hair over 56% of 2023-2024’s share of cumulative retail sales across the US). If indeed accurate - this gives the disparity between their assessed r-values (-0.3116 in 2023-2024 vs. -0.2458 in 2018-2019) “more teeth.”
So let’s assume that there’s some legitimate weight to these YoY correlation coefficients. This brings up some intriguing talking points:
What could account for the precipitous rise in correlations between combined wind/solar and lower electricity pricing between 2020-2021 and 2021-2022; other than almost 95,000 GWh/hours of new power generation?
Utility-scale BESS first appeared on in 2020. As cited in A Pragmatist’s Guide to Energizing the USA - 39 states showcased storage capabilities that cumulatively surpassed both 8.8 GW in power capacity, and 11.1 GWh in energy capacity by the end of 2022. Could the value stacking advantages of firming (over the short term) renewables – especially during periods of peak demand across our domestic grid – prove to be a significant contributor to these improved correlations?
The Bipartisan Infrastructure Law (BIL) came to fruition in November 2021; right after the 2020-2021 group eclipsed. While the BIL didn’t change investment or production tax subsidies for renewable systems – it did support new transmission, distribution, and energy storage assets; as well as encourage more grid flexibility (through expanding the Smart Grid Grant program)
The Inflation Reduction Act – enacted right at the end of the 2021-2022 group – DID increase said credits from 22% to 30%. These expanded credits took effect at the commencement of 2023.
Interestingly enough – the fiscal benefits afforded by these expanded credits doesn’t seem materialize along the above line graph, and the correlations between increased wind/solar power generation markets shares, and lower grid costs
Even with 64,662 GWh more energy output from VRE on our grid in 2023-2024 when compared to 2022-2023 – both wind and solar’s correlation with lower retail prices seemed to slightly depress. Conventional wisdom dictates that the economic merits of VRE penetration on the US energy matrix will ultimately (and perhaps quite calamitously) decline beyond a certain point; in the absence of any prevailing, reliable, and scalable long duration energy storage (LDES) vehicles. Could we already be seeing this decline beyond 2022-2023’s total domestic market share of (just over) 15%?
This will be a trend/phenomenon worth tracking over 2025, 2026, and beyond…
If you’ll recall – coal-fired generation appeared to exhibit an even more profound connection to lower electricity retail prices than combined wind/solar in terms of % of total, state-by-state power generation, and % of state electricity sales. And natural gas – surprisingly – looks to yield the opposite trend: the more natural gas generation constituting a given state’s energy demands; the higher its grid costs appear. What do these correlations look like over the aforementioned six-year window? We’ll definitely explore these in the near future. But first – we’ll expound a little further on the cousin of utility-scale VRE: BTM solar on the US grid...