BTM Solar Production Correlations with Average Retail Electricity Rates: 2018-2024
4/8/2025
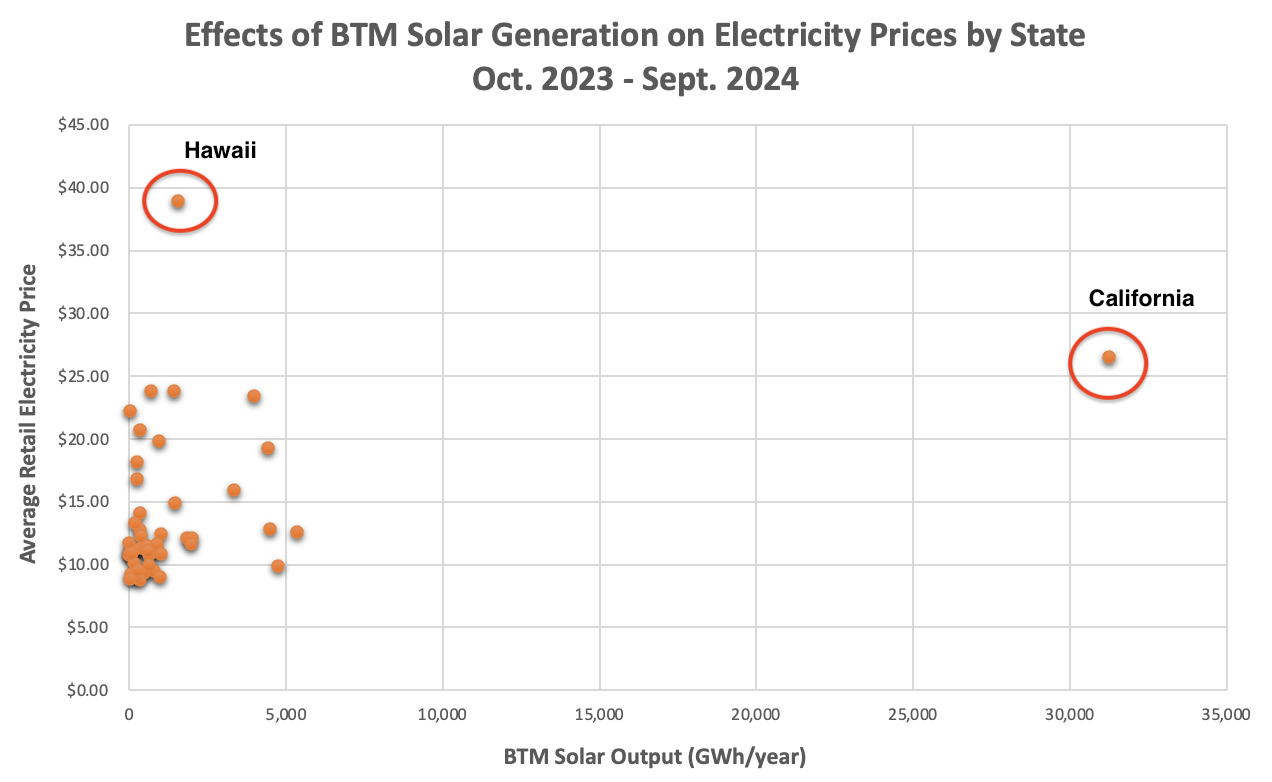
In our “’23-’24 Statistical Correlations” evaluation – behind the meter (BTM) solar complexes (in terms of state-by-state, cumulative energy generation) showcased a very weak, positive correlation with average retail electricity costs across the US grid; falling below the delineated, |0.3| Pearson correlation r value over a 12-month window between October 2023 and September 2024.
But – as stated inside the grid-scale “VRE Correlations” subpage – a 12-month snapshot likely doesn’t do an analysis of this scope much justice… What do these BTM solar correlations look like under a little more scrutiny over a prolonged period of time?
To kick things off – please note that the scatter plots involving BTM Solar output and respective, average grid costs revealed two outliers (instead of just one for all utility-scale assemblies): Hawaii AND California:
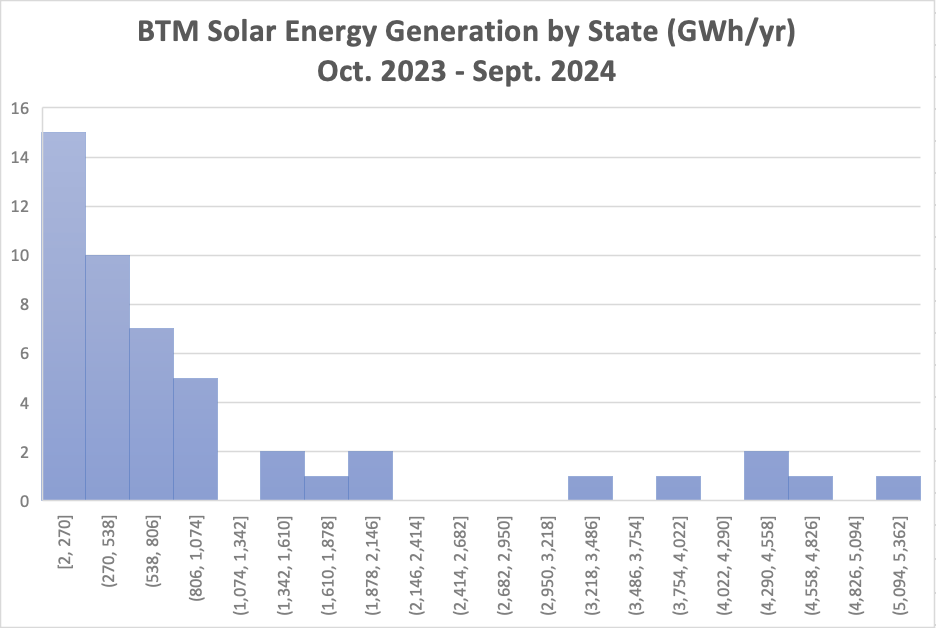
Next, let’s take a look at the normality of GWh/year power output data; specifically, in between 2023 and 2024, and 2018 and 2019. According to the following histograms – said data (like its utility-scale counterparts) looks non-parametric.
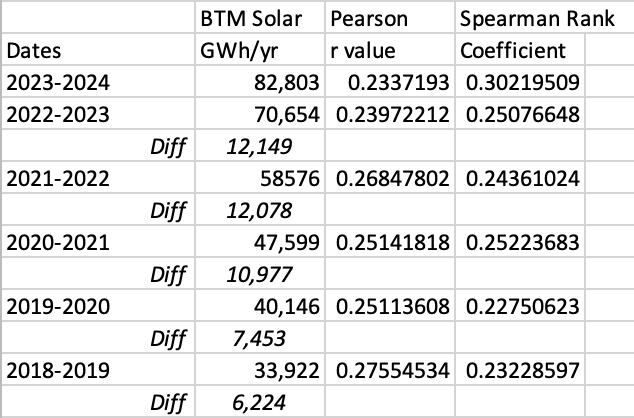
The ensuing chart aligns both correlation coefficients with their respective 12-month grouping, and their amassed, BTM solar production figure (in GWh/year).
Unlike their utility-scale counterparts – correlation variances between BTM solar energy volumes and retail costs for utility electricity are marginal at best. Even though amassed BTM solar outputs mushroomed by over 2.5 times over five years from 2018-2019 and 2023-2024; the measured correlation between BTM solar generation and grid costs were still notably weak. The following graph illustrates the relative flatness of any correlations between BTM solar capabilities, and resultant costs for grid-based electricity; even though these annual groups (identified by each data point) exhibited statistically significant divergences in data via an ANOVA single-factor analysis (the 3.2306 F-value exceeded the F-critical demarcation of 2.453, and the p-value of 0.0074 fell well below 0.05)
Note that:
Even though BTM Solar data appeared non-parametric – Pearson Correlation coefficients were once again leveraged within the aforementioned line graph; really more for the sake of continuity with the combined VRE study.
While the Spearman Rank coefficients exhibit a similar, muted variance to these Pearson r values; the 2023-2024 group’s 0.3022 is conspicuous! What could have happened within this data to usurp such a jump in BTM solar-to-electricity costs correlation (from decidedly “weak” to “mild”)
A contributing factor was South Dakota. EIA records didn’t log any BTM solar within the state until 2024, then logged a whooping 7 GWhs in the 2023-2024 group. Average electricity costs in SD are ranked the 14th lowest across all 50 states in 2023-2024. So paltry and abysmally-ranked energy outputs within states with relatively lower retail costs might tilt a population correlation (based in ordinal data) a little more obtusely than necessary…
Removing SD data from the 2023-2024 group Spearman Rank analysis results in an r value of 0.2888; still notably higher the other five coefficients, but below the |0.3| threshold
Data integrity could be an issue with some of the EIA’s BTM solar data. Aside from South Dakota – North Dakota has yet to yield any BTM solar energy as of the conclusion of September 2024. Alabama didn’t record any BTM solar output until 2021-2022 when it hit one total GWh. During 2023-2024 – AL achieved just two GWhs in BTM solar generation over a 12-month span
While difficult to confidently outline – data integrity is likely an issue across multiple power generation line items within the EIA platform; including utility-scale renewables, coal-and gas-fired combustion, nuclear, etc. However – data transformations (i.e. converting statewide GWh/year records into % of sale and total energy production) should help marginalize the impact of inaccurate/incomplete data…
So BTM solar demonstrates an almost negligible congruence with utility prices. Is that really all that farfetched?
While BTM solar is indeed connected to the grid; it primarily feeds specific C&I and/or residential users. Grid injections only transpire during episodes of surplus electrons (when supply outweighs demand). In other words – BTM solar isn’t intended to supply the grids; unlike utility-scale VRE platforms!
Nevertheless – balance-of-system costs (i.e. the permitting, manpower, and hardware interties between BTM solar and the local, utility grid) aren’t necessarily marginal, and are often fronted by the utility (unless under more complicated circumstances).
A public baseline for estimated grid interconnection costs range from $100-$300 per system kW: https://thundersaidenergy.com/downloads/wind-and-solar-costs-of-grid-inter-connection/#:~:text=Costs%20are%20highly%20variable.,of%20the%20inter%2Dconnection%20point.
Note that these ranges can vary substantially; ascending from practically nonexistent to within this aforementioned window
Frequency balancing by grid operators (when excess energy originating from BTM solar is fed onto the grid) isn’t trivial either
Even though BTM solar is an insignificant contributor to the energy grid – there are burdens that said grid needs to account for in order to accommodate (especially HIGH) volumes of BTM solar. But these correlations between BTM solar generation footprints and respective, regional grid costs insinuate that these burdens are nominal.
In the worst case – relatively high volumes of BTM solar only very weakly provoke increases in retail electricity costs
Alright - now we can conclude our statistical correlations involving renewable energy and grid costs.
Next up: a long-term evaluation of coal-fired combustion on our domestic electricity prices